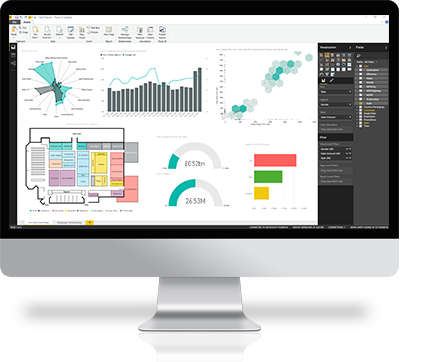
Power BI Transforms
Your Data into Rich Visuals
Right Information to the Right People at the Right Time to make knowledgeable decision.
Insights at Your Fingertips
Utilize Power BI and gain a competitive advantage by connecting, combining and analyzing your entire data estate. Power BI ensures and enables smooth collaborations between business stack holders, IT professionals and data analysts, through a single unified version of data truth, which in turn provides insights across your organization. Unlock the full potential of Azure by employing advanced machine learning and AI capabilities within Power BI. Irrespective of the size or type of data, Power BI can analyze your entire Azure data estate with efficiency and ease. You will be able to take quick decisions. Therefore your go to market approach is quicker and smoother.

We Hear You
We bring life to your data. Visualizing your data in real time becomes easy and hassle free, with the integration of Power BI solutions through iBeris power BI services. We give data insights at your fingertips.

Customizable
We are open to customization. We offer an advanced and personalized Power BI experience with custom tools and services, tailored to fit your business needs. Custom data visualizations are made possible, with visualization tools.

24/5 Support
iBeris guarantees 24/5 assistance with a highly qualified team of Power BI experts, through support tickets in the Center Support Portal. On Weekends we provide email support. Set up your Power BI services with ease and choose from our extensive cloud support options.

Secure & Sharing
With our Microsoft Power BI services you can stay secure, as our data storage security consists of two separate repositories for storing and managing data. Our multi-tenant environment security and networking services further adds to the existing security measures.

Advanced Data Services
Our advanced data modelling empowers businesses to efficiently analyze and understand data requirements. With XMLA endpoint in the Power Bi service, manage advanced data services with efficiency and host advanced data models by deploying the functions of Power BI.

Interactive UX
Interactive UX operations are made possible with iBeris Power BI managed services. Our interactive UX end user experience monitoring solution displays complete data sets that are essential for your workspaces. Background operations like dataflow are refreshed and classified as background operations.
Why IBERIS For Power BI

Technical Exploration
Our professionals are certified by Microsoft to cleanse, build, filter and envision dashboard reports with features. We handle data of huge volumes such as terra bytes.

Security & Access
The dashboards and reports contain role-based access, integrated with existing systems such as active directory, or any other SSO for login purposes.

Highlighting Reports
At iBeris, we have done custom reporting & dashboard generation for dealers & manufacturers of iron & steel corporations in the Asia pacific, middle east and Europe.

Expertise
At iBeris, we have extensive experience & expertise in the area of applying Power BI tools for the IT hardware and automobile manufacturing sectors at a global level.
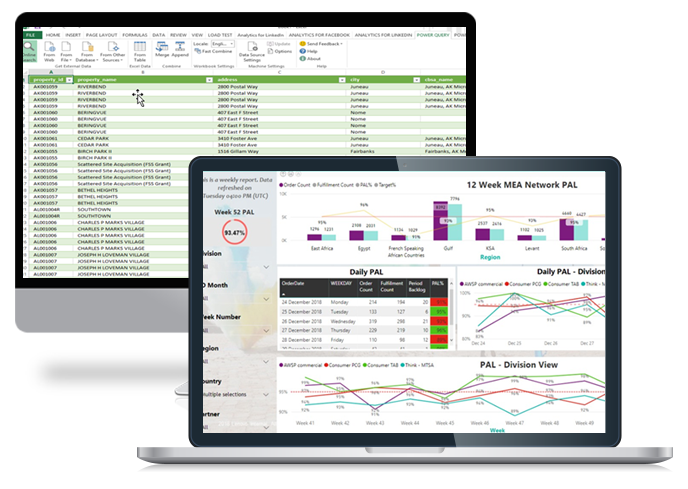
Power BI Desktop
- Data Discovery & Exploration: Through powerful data prep and freeform drag-and-drop canvas designed for visual data exploration.
- Interactive Reports: Connectors for a broad range of data sources
- Custom Visuals: Import custom interactive visualizations that work and integrate like out-of-the-box visualizations.
- R Integration: Import R scripts and visualizations into your reports.
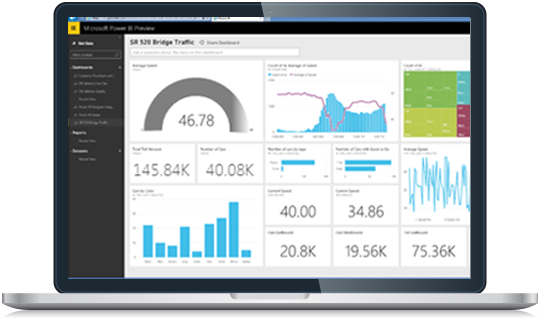
Live Dashboard & Reports
- Live dashboards provide a 360º view of your business
- Track your data in real-time with support for streaming data
- Drill through to underlying reports to explore and discover new insight
- Pin new visualizations and KPIs to monitor performance
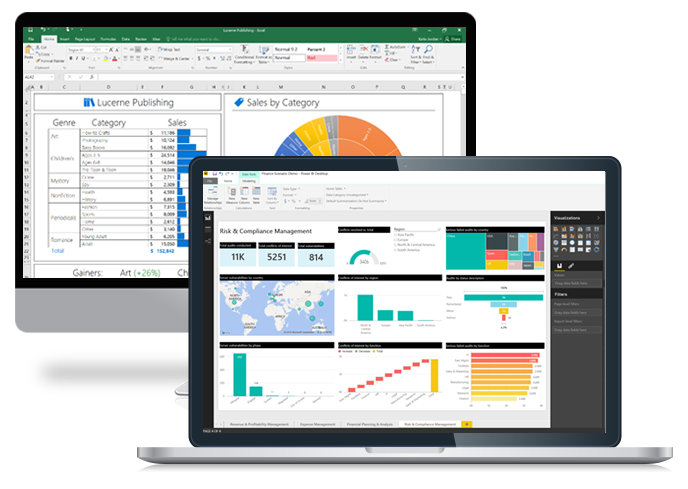
Powerful Self-service Business Analysis
- Familiar data preparation experience across tools
- Connectors for a broad range of data sources
- Create analytical spreadsheets and interactive visual reports
- One click publishing to Power BI
Features of Power BI
- Create an engine for business-changing insights with Power BI and Azure Synapse Analytics.
- Accelerate performance with industry-leading BI and data management solutions on the market.
- Power BI and Azure Synapse are natively integrated so users can seamlessly and analyze petabyte-scale data in seconds.
- Bring data into every part of your organization in a simple, unified, and scalable experience.

FAQ for Power BI
Who is a Power BI business User?
Your job description dictates how you interact with Power BI. As an end user or business owner, you can receive content (dashboards, reports and applications) from colleagues. If you work on the online or mobile version of Power BI, you can utilize the Power BI service to review and interact with content that helps you make business decisions.
Does Power BI support mobile devices?
Yes. Power BI has native apps for Android phones and tablets, iOS devices, and Windows 10 devices. Download one of the Power BI mobile apps from its respective store.
How do we manage Power BI?
Power BI provides a Power BI admin portal for users in the Microsoft 365 Global Administrator role and users in the Power BI Service administrator role. To use the Power BI admin portal, you must mark your account as a Global Administrator within Microsoft 365 or Azure Active Directory, or someone must assign the Power BI service administrator role to your user account.
Are the Business Central apps for Power BI available in languages other than English?
No. These apps are currently only available in English.
Can I link more than one Power BI workspace to a single Azure Synapse Workspace?
Yes, as of June 10, 2021, Synapse Studio now allows you to add more than one Power BI workspace to a single Azure Synapse Workspace.
Does Azure Synapse workspace Support CI/CD?
Yes! All Pipeline artifacts, notebooks, SQL scripts, and Spark job definitions will reside in Git. All pool definitions will be stored in Git as Azure Resource Manager (ARM) templates. Dedicated SQL pool objects (schemas, tables, views, etcetera.) will be managed with database projects with CI/CD support.